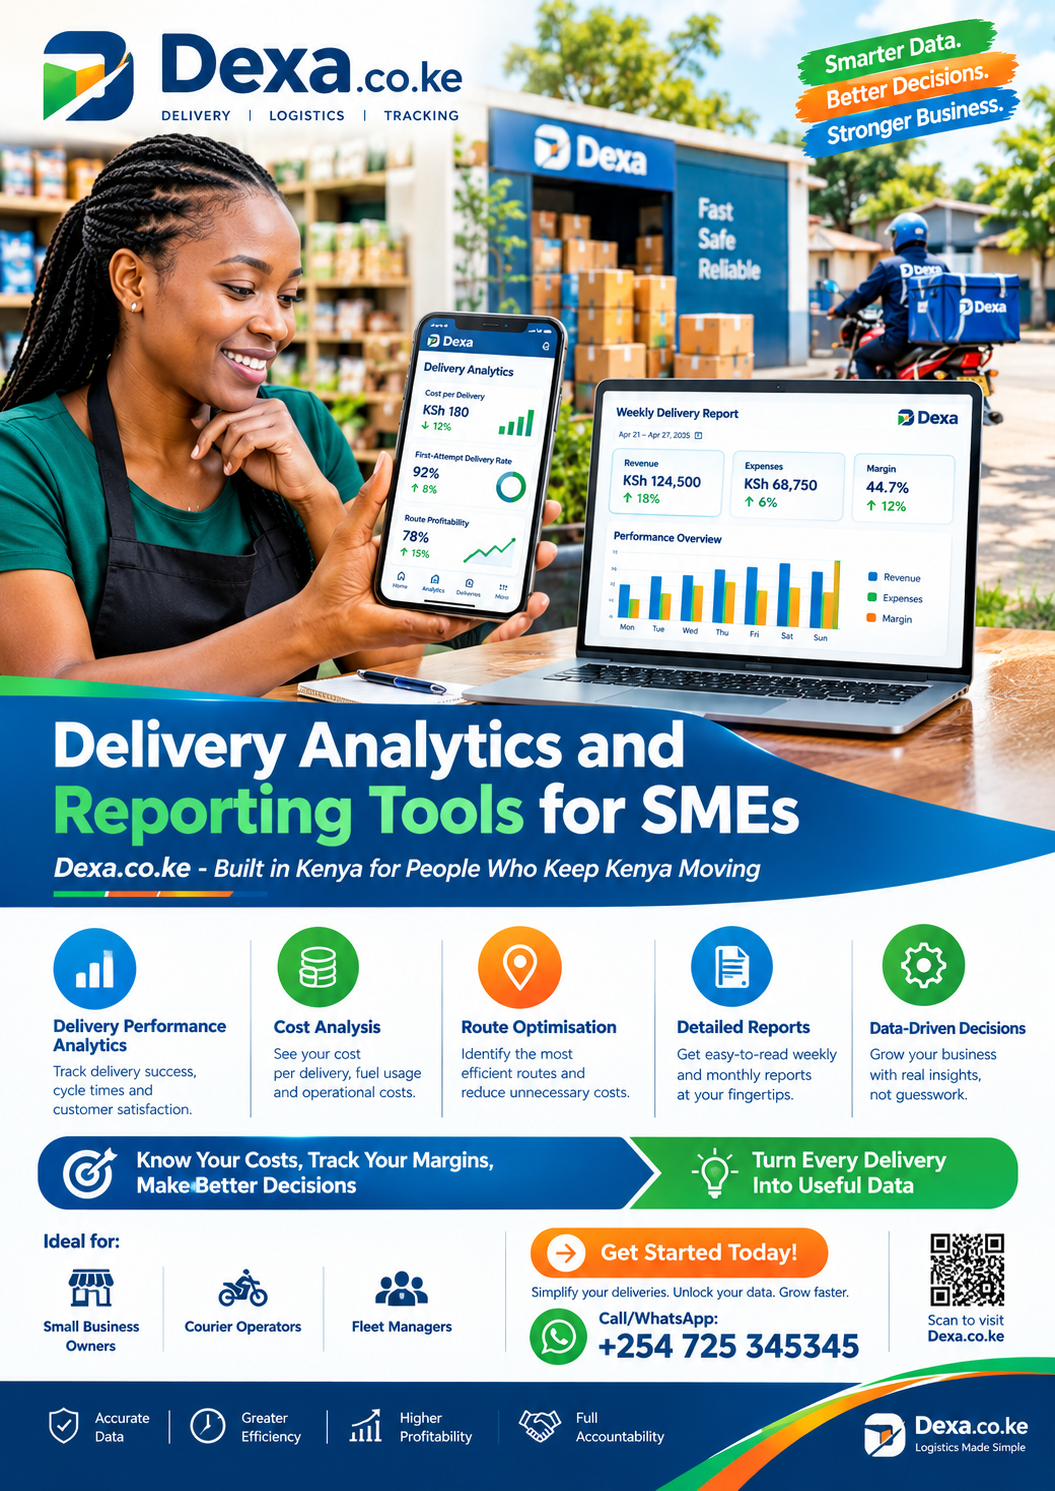
Delivery analytics and reporting tools for SMEs address a problem most small and medium courier businesses do not realise they have: they are already generating valuable data every single day, and almost none of it is being used. Every delivery produces a record of distance, time, cost, payment, and outcome. Every rider produces a pattern of efficiency, reliability, and fuel consumption. Every route produces information about traffic, delays, and repeat customers. Delivery analytics and reporting tools for SMEs take that raw material and turn it into decisions.
The gap is not a lack of data. It is a lack of structure. When delivery information lives in notebooks, WhatsApp threads, and memory, it never becomes anything more than a record of what happened. When it lives in a proper system, it becomes a picture of why things happen and what to do about them. That transformation sits at the heart of what delivery analytics and reporting tools for SMEs are for.
Why SMEs Need Analytics More Than Large Operators
There is a common assumption that analytics belongs to big companies with dedicated data teams. In practice, the opposite is closer to the truth. A large logistics operator can absorb inefficiency because it has scale and reserves. A small business cannot. Every wasted trip, every unprofitable route, every rider who consumes more fuel than necessary comes directly out of a margin that is already thin.
The practical value of delivery analytics and reporting tools for SMEs therefore sits in the decisions they enable rather than the reports they produce. A five-rider operation that discovers one of its regular clients has been unprofitable for months can act immediately. A business that never sees the numbers cannot act at all.
The Metrics That Actually Matter
Analytics can produce endless numbers, and most of them are distractions. A small delivery business needs a handful of metrics that directly inform decisions, and it needs them presented clearly rather than buried in dashboards.
Cost Per Completed Delivery
This is the single most important figure in any delivery operation, and it is the one most businesses cannot calculate. It includes fuel, rider commission, an apportioned share of maintenance, airtime, and the cost of any failed attempts attached to that order. Analytics and reporting tools for SMEs that produce this figure at the individual order level give the business something it can actually act on.
First-Attempt Delivery Rate
The proportion of deliveries completed on the first attempt determines the true economics of every parcel. Each failed attempt roughly doubles the cost of that delivery, because fuel is consumed twice and the rider is paid twice while revenue remains unchanged. Tracking this metric reveals whether addressing problems, communication gaps, or rider navigation issues are eroding margins. A small improvement in this single number often produces a larger financial effect than any negotiation over rates.
Revenue Per Rider Hour
Comparing what each rider generates against the hours they work reveals efficiency differences that productivity counts alone conceal. Two riders completing the same number of deliveries may produce very different returns depending on route selection, fuel consumption, and the number of repeat attempts they generate. This metric supports fairer performance conversations and better allocation of work.
Route and Zone Profitability
Aggregating delivery outcomes by route or delivery zone shows which parts of the city generate margin and which consume it. A business may discover that an apparently busy area loses money on every trip while a quieter corridor is highly profitable. Decisions about pricing, coverage, and rider allocation follow directly from this information, and they are impossible without it.
Payment Method Mix and Collection Efficiency
Tracking what proportion of orders are paid in cash versus mobile money, and how quickly collections are reconciled, reveals both financial risk and cash flow characteristics. A business with heavy cash exposure benefits from knowing precisely how much of its revenue arrives in physical form and how long it takes to reach the bank.
What Reporting Should Look Like
A report is only useful if someone reads it and understands it. The best delivery analytics and reporting tools for SMEs produce outputs that a business owner can review in a few minutes and act on the same day.
The daily summary is the most frequently used report. It shows deliveries completed, revenue collected, payments outstanding, and any variances that require attention. Its purpose is operational: to confirm that the day went as expected or to flag something that needs action before it compounds.
The weekly review provides a slightly longer view. It shows trends in volume, cost per delivery, first-attempt rates, and rider performance. Its purpose is tactical: to identify patterns that are not visible in a single day and to inform decisions about the coming week.
The monthly report serves a different function. It aggregates revenue, expenses, and margins across the period, producing the figures a business needs for tax preparation, lender conversations, and strategic planning. Its purpose is financial and structural rather than operational.
How Dexa.co.ke Approaches Analytics
Dexa.co.ke was built for the Kenyan market rather than adapted from a foreign model, and its structure reflects how delivery businesses here actually operate. The platform splits into two products, each suited to a different stage of growth, and both treat reporting as a standard output rather than a feature reserved for larger accounts.
For sellers and operators working with one or two trusted riders, the independent driver model fits naturally. Analytics in this arrangement matter because a solo operator has no finance team to interpret the numbers and must rely on clear, simple reporting. For operations that have outgrown informal arrangements and now coordinate several riders, the courier team model provides the analytical depth that delivery analytics and reporting tools for SMEs require at volume.
For Independent Drivers
A rider using this arrangement creates their own customer channel, sharing a personal booking link with businesses on WhatsApp and receiving direct bookings rather than competing for work in a crowded marketplace. From the business’s side, this simplifies matters considerably: one known contact, one consistent standard, one person accountable for each delivery.
The rider benefits too. Rather than chasing one-off trips, a driver builds a roster of regular business clients, plans pickups in advance, and tracks earnings in one place. When earnings and costs are recorded alongside each job, the rider develops an accurate sense of which work is genuinely worth taking and which only appears attractive before expenses are counted. Reliable delivery analytics and reporting tools for SMEs therefore serve the rider’s interests as much as the business’s.
For Courier Teams
Teams managing several riders and a steady flow of orders need structure that informal arrangements cannot provide. The platform keeps one operating record from request to receipt, so no order has to be reconstructed from scattered chats. Each parcel carries its customer details, assigned rider, agreed price, payment status, proof of delivery, and associated expense along with it.
For a business working with a courier team, this makes delivery analytics and reporting tools for SMEs routine rather than burdensome. Dispatch is organised, riders know their assignments, and the analytical picture builds itself from records created as work happens. When the owner asks whether last month was profitable, the answer is already available rather than assembled from a shoebox of receipts.
Turning Numbers Into Decisions
Analytics has no value unless it changes something. The point of collecting delivery data is to make better decisions, and several categories of decision become possible once the numbers are clear.
Pricing becomes evidence-based. A business that knows its true cost per delivery can set rates that produce a target margin rather than guessing at what the market will bear. It can also identify clients or order types that should be priced higher or declined altogether. This shift from intuition to calculation is one of the most direct benefits of delivery analytics and reporting tools for SMEs.
Coverage decisions become rational. If outer zones consistently lose money, the business can adjust pricing there, set minimum order values, or route those deliveries differently. Expansion into new areas becomes a calculation rather than a gamble.
Fleet decisions improve. Knowing the real cost per kilometre of each motorcycle informs decisions about maintenance, replacement, and whether a particular vehicle has become a net drain. The data also supports the case for switching to electric motorcycles, since the cost difference becomes visible in the numbers rather than remaining a general impression.
Rider management becomes fairer and more effective. Performance discussions can reference actual fuel efficiency, first-attempt rates, and profit contribution rather than vague impressions. This tends to be better received than criticism based on intuition, and it produces more durable improvements.
The Reporting Tools SMEs Actually Need
Feature lists can be overwhelming, so it helps to focus on what a small delivery business genuinely requires.
Automatic data capture is the foundation. If recording a delivery requires manual entry beyond what the rider would do anyway, the data will be incomplete. Reporting tools for SMEs must draw their information from the natural flow of work rather than adding administrative steps.
Per-order profitability is the next requirement. Reports that show only monthly totals cannot support decisions about individual clients, routes, or order types. The business needs to see profit at the level where decisions are actually made.
Exportable records matter for compliance and finance. Reports should be downloadable in formats that support accounting, tax preparation, and any conversation with a lender or investor. Businesses that maintain clean, exportable records find these conversations considerably easier than those reconstructing figures from paper.
Simple visual summaries help. A business owner reviewing performance on a phone needs clear charts and concise figures rather than dense spreadsheets. The most useful reporting tools for SMEs present information in a form that can be understood in a few minutes and acted upon the same day.
Common Mistakes in Delivery Reporting
Several patterns appear repeatedly when small businesses attempt to use delivery data.
The first is collecting data without reviewing it. A system that records everything but produces reports nobody reads is not providing value. The discipline of reviewing reports regularly, even briefly, is what turns data into decisions.
The second is focusing on revenue alone. Revenue growth can mask deteriorating margins for months. A business that tracks income but not cost per delivery may discover too late that its expansion has been unprofitable.
The third is ignoring failed deliveries. These are the most commonly omitted cost because they never appear as a transaction. The trip simply happened twice, and no invoice reflects the duplication. Proper delivery analytics and reporting tools for SMEs record these explicitly, because they are often the difference between a profitable route and an unprofitable one.
The fourth is treating rider pay separately from the order record. When commissions are calculated from delivery counts rather than attached to specific orders, the business cannot see the true cost of each job. The connection between revenue and its associated labour cost is lost.
Building Analytics Into Daily Operations
The businesses that benefit most from delivery analytics and reporting tools for SMEs are those that build reporting into their daily rhythm rather than treating it as a periodic exercise.
A brief morning review of the previous day’s numbers takes minutes and keeps problems from accumulating. A weekly session of fifteen minutes identifies trends and informs the coming week’s decisions. A monthly review produces the figures needed for financial and strategic purposes.
This rhythm matters because delivery problems compound quietly. A route that loses money does so incrementally. A rider whose fuel consumption creeps upward does so gradually. Analytics that are reviewed regularly catch these trends while they are still small, and small corrections are considerably cheaper than large ones.
The Direction Delivery Analytics Is Heading
Several shifts are reshaping how delivery businesses understand their operations in Kenya. Mobile money integration continues to deepen, and the connection between payment records and delivery records is becoming tighter, which means revenue data is increasingly automatic.
Electric motorcycles are becoming more common, and their cost profile differs substantially from petrol machines. Charging costs a fraction of fuelling, and maintenance requirements are lighter. Businesses tracking expenses carefully will find that the switch changes their margins in ways visible in the data well before they are visible in the bank balance.
Government investment in intelligent traffic management is gradually improving movement across Nairobi, which will reduce fuel wasted in congestion and improve delivery times. For businesses tracking costs, these improvements will appear as improved margins on existing routes.
What will not change is the underlying requirement: a delivery business needs to know what it earns, what it spends, and whether the difference constitutes a living. That requirement sits at the centre of what delivery analytics and reporting tools for SMEs should deliver.
Choosing the Right Reporting Tools
Businesses evaluating options should focus on a few practical questions. Does the system capture data automatically, or does it require manual entry? Can it produce profit figures at the individual order level? Are reports simple enough to review daily? Can records be exported for accounting and tax purposes? Does the reporting connect to payments, proof of delivery, and rider assignments, or does it sit in isolation?
A system that answers these well is one that will not create new problems as volume rises. A system that answers only some will leave gaps, and gaps are where money disappears. The difference between the two is rarely visible in a demonstration, which is why testing with real orders across a fortnight is worth the effort before committing.
The Business Case for Analytics
Analytics costs money, which leads some businesses to treat it as discretionary. The calculation is more favourable than it first appears.
A single unprofitable route, identified and corrected, can save more over a year than the cost of the reporting tools that revealed it. A modest improvement in first-attempt delivery rates changes the economics of every parcel. Better pricing decisions, informed by actual cost data, improve margins across the entire operation.
There is also a growth dimension. Businesses that can demonstrate clean records and clear performance data win contracts that informal operators cannot. Corporate clients, pharmacies, and financial institutions all require delivery partners who can document their processes and report on their performance. Proper delivery analytics and reporting tools for SMEs open doors that remain closed to operations relying on instinct.
Delivery analytics and reporting tools for SMEs are not a luxury reserved for large operators. They are the instruments that tell a small delivery business whether its work is building something or quietly consuming it. Revenue without cost visibility is a comforting number that can conceal serious problems for months.
Whether you are running a single motorcycle from a single room or coordinating a fleet across the city, the tools behind delivery analytics and reporting tools for SMEs from dexa.co.ke connect every delivery to its revenue, its costs, and its contribution to the bottom line. From the first order request to the final reconciliation, the numbers stay together.
The businesses that survive and grow are the ones that treat visibility as a foundation rather than a year-end exercise. Build the habit early, let it carry the weight as volume rises, and the question of whether you are making money stops being a guess.